Background
We have five exercises on discrete maps. This one develops the main tools, and should be done before the other four.Often models of nature have a discrete deterministic structure. A classic example is in population dynamics, where one hypothesises that the number of rabbits in year $x_n$ is simply a function of the number in the previous year: $$x_{n+1}=f(x_n).$$ If $f(x)$ is linear one has the logistic equation, and the number of rabits grows exponentially. This is a reasonable model if there are infite resources no preditors. The next most sophisticated model would be to add a nonlinear term representing either the finite resources or the role of preditors. This gives the logistic map $$f(x)= 4 \mu x (1-x),$$ which is a map of the interval $(0,1)$ onto itself. There is one parameter $\mu$, which will change the behavior of the map. For example, at $\mu=1$, this function precisely folds the unit interval in half and stretches it (nonuniformly) to cover the original domain. It turns out that this simple map displays some complicated behavior.
Learning Goals
Science: You will learn about Chaos and discrete maps.
Computation: You will learn about iterative algorithms.
Procedure
- Create a new directory
- Download Logistic iteration hints, and rename it IterateLogistic.py.
- Open this file in a text editor (kate or emacs -- we recommend against using kedit) or load it into the IPython dashboard (started with ipython notebook --pylab inline. In this file, you will notice Python code that has already been written, but it mostly consists of hints to help you flesh out the code, i.e., comments (lines that begin with #) and documentation strings (material enclosed in triple quotes """ that document what each module, class, and function is about and can be queried with the Python help() function). You will also notice the keyword pass embedded within each function body: pass is a legal Python expression that means "do nothing". The first thing you will do when you start to define a function is to remove the pass statement and replace it with new code.
- Open a terminal window, move to the correct directory and start ipython, or click on the notebook in the dashboard. You will find it convenient to start python with the --pylab flag -- ie type ipython --pylab or ipython notebook --pylab.
- define a function f(x,mu) which when called with $x$ and $\mu$ returns $4\mu x (1-x)$.
- Use pylab commands to plot f as a function of x for different values of mu.
- Write a function Iterate(g, x0, N, mu) which is passed a function g, an initial point x0 and integer N and a parameter mu which returns g(g(...(g(x0,mu),mu)...). That is it iterates the function N times, starting at x=x0.
- Test this function with f. Are there any other functions you can write to test it more easily?
- Write a function IterateList(g, x0, N, mu) which acts just like iterate, but returns a list of the sequential values of x. (A more verbose description is in the hints file.)
- Play a bit with this function.
- Type ylim((0,1)) then plot(IterateList(f,0.5,100,0.1)). This should make a graph of the iterates of x, starting with x0=0.5, using mu=0.1. As you can see, the bunnies don't do so well for small mu.
- Try different values of mu. You should find that mu=0.25 is special. How does the behavior of the iterates change when mu>0.25?
- How does the behavior change when mu>0.75?
- To explore this structure in more detail, see
- Period Doubling Routes to Chaos
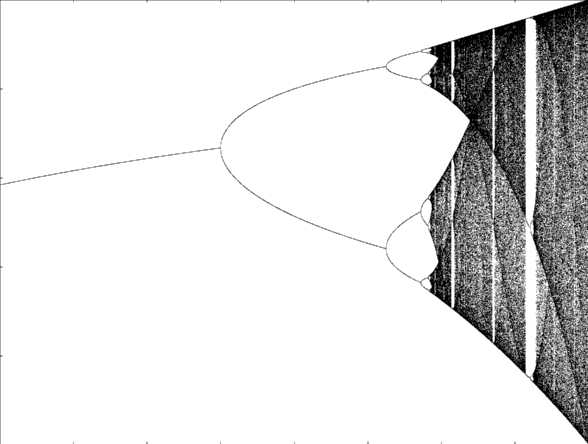
- this structure can be compactly encoded in a "bifurcation diagram"
- Write a function BifurcationDiagram(g, x0, nTransient, nCycle, muArray, showPlot) which takes as arguments:
- g -- a function
- x0 -- the starting value for the iterates
- nTransients -- an integer
- nCycle -- another integer
- muArray -- a list of mu values
- showPlot -- True/False
- Try the following parameters:
- BifurcationDiagram(f, 0.1, 500, 500, scipy.linspace(0., 1.00001, 200))
- BifurcationDiagram(f, 0.1, 500, 500, scipy.linspace(0.85, 1.00001, 300))
- BifurcationDiagram(f, 0.1, 500, 500, scipy.linspace(0.96, 0.97, 400))
- To explore this structure in more detail see Fractal Dimensions
James P. Sethna, Christopher R. Myers, Erich J. Mueller.
Last modified: September 2014
 Statistical Mechanics: Entropy, Order Parameters, and Complexity,
now available at
Oxford University Press
(USA,
Europe).
Statistical Mechanics: Entropy, Order Parameters, and Complexity,
now available at
Oxford University Press
(USA,
Europe).